Wouldn’t it be nice if all the aeronautical charts we use came georeferenced so we can load into our different apps or GIS? It would be even better if they were already in an electronic way directly being updated and just visualized through any system we wanted, there are plans for that somewhere in the future. AIXM will contribute with data sets hopefully or ultimately a new format will just come and gain traction.
First open Inkscape and load the PDF of the aeronautical chart you want to georeference, then drag and drop on the main window, you will get a menu like this. Be sure to import the correct page from the PDF. If your chart is already in an image format you can skip this step.
Sometimes you will need to experiment on the best settings for your particular chart. In my case I just left the default options. It is also important to notice that sometimes you do not have the same fonts installed as who produced the PDF in this case it would be better to get either a scan or a high resolution screenshot which will not alter the content.

Now export as a high resolution image so that you do not loose any details. Make sure at this point that whatever is imported into Inkscape looks exactly the same as the source material.
Update: It just happened that I didn’t have the fonts used and it messed up the export. So I opened it in Adobe Acrobat instead and exported the relevant page as a TIFF with 600 dpi which should be enough.


Here is the TIFF image export preview that I checked before moving forward, it all looked OK

Now open QGIS preferably latest version, then go to Raster and select Georeferencer (if you don’t see the option you may need to enable the relevant setting)

Click on the open raster option and load your exported image


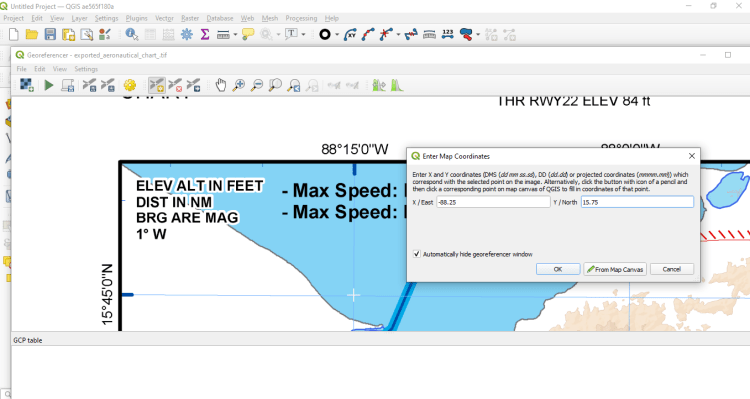
Now we are going to add 4 control points, one on each “corner” as precisely as we can, we will use the grid to be able to input the coordinates. Click on Add Point

Make sure to put the cross hair the best you can by zooming and then input the coordinates in the “Enter Map Coordinates” box. Repeat for the other 3 corners.

You will end up with something like this, needless to say that what is inside the points will be more accurate than what it is outside

Now let’s choose a transformation setting, Click on Setting and then Transformation Setting.

Choose a transformation that provides Residual closer to 0, in my case I used Projective Thin Plate Spline with the following settings and saved to disk

My residuals look pretty good as they are very close to 0

The georeferenced image is now added in QGIS, I added OSM Standard as basemap and the TMA that I had drawn before for a drone map project. Looks pretty good.


You can see the TMA matches great on the upper left corner.
To save as GeoPDF, click Raster > Conversion > Translate

Make sure the right input layer is selected and choose EPSG 4326: WGS 84

Click on save to file

Choose PDF as type, put the desired file name and click Save

Click run now

View in QGIS with OSM as background and some opacity


Load and enjoy in foreflight

Update: I discovered foreflight already had done a similar post here How do I create a geospatial PDF? – ForeFlight Support OK but my chart is in color at least 🙂


0 Comments